The following diagram indicates the energy levels of a certain atom when the system moves from $4E$ level to $E$. A photon of wavelength $\lambda_1$ is emitted. The wavelength of photon produced during its transition from $7/3\,E$ level to $E$ is $\lambda_2$. The ratio $\lambda_1 / \lambda_2$ will be 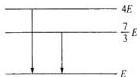
A$\frac{9}{4}$
B$\frac{4}{9}$
C$\frac{3}{2}$
D$\frac{7}{3}$
Answer & Solution
Correct answer: B. $\frac{4}{9}$
For an emitted photon, energy difference and wavelength are related by $$\Delta E=\frac{hc}{\lambda}.$$ So wavelength is inversely proportional to the transition energy.
For the transition from $4E$ to $E$, the emitted energy is $$\Delta E_1=4E-E=3E.$$
For the transition from $\frac{7}{3}E$ to $E$, the emitted energy is $$\Delta E_2=\frac{7}{3}E-E=\frac{4}{3}E.$$
Hence $$\frac{\lambda_1}{\lambda_2}=\frac{\Delta E_2}{\Delta E_1}=\frac{\frac{4}{3}E}{3E}=\frac{4}{9}.$$
On checking the options, this matches option $\frac{4}{9}$.
Related questions
In gamma decay, what is emitted?A positron has the same mass as an electron but a charge that is:In beta decay, which particles may be emitted?In alpha decay, which nucleus is emitted?How many types of radioactive decay occur in nature?Radioactivity is a decay undergone by a nucleus that is:Becquerel's emission penetrated black paper and:Becquerel made his discovery while studying: