A radioactive sample consists of two distinct species having equal number of atoms initially. The mean life time of one species is $\tau$ and that of the other is $5\tau$. The decay products in both cases are stable. A plot is made of the total number of radioactive nuclei as a function of time. Which of the following figures best represents the form of this plot
A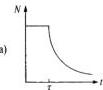
B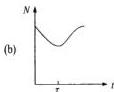
C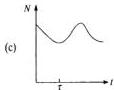
D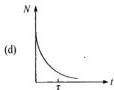
Answer & Solution
Correct answer: D. 
Let the initial number of atoms of each species be $N_0$. Then the total number of radioactive nuclei at time $t$ is
$$N(t)=N_0 e^{-t/\tau}+N_0 e^{-t/(5\tau)}.$$
At $t=0$,
$$N(0)=2N_0.$$
As $t$ increases, both exponential terms decrease continuously, so $N(t)$ must decrease continuously.
Also,
$$\frac{dN}{dt}=-\frac{N_0}{\tau}e^{-t/\tau}-\frac{N_0}{5\tau}e^{-t/(5\tau)}<0,$$
so there cannot be any flat part or increase.
Further,
$$\frac{d^2N}{dt^2}=\frac{N_0}{\tau^2}e^{-t/\tau}+\frac{N_0}{25\tau^2}e^{-t/(5\tau)}>0,$$
so the curve is concave upward throughout. It falls rapidly at first and then more slowly, approaching zero asymptotically.
Among the given figures, only option $D$ shows a monotonically decreasing, concave-up decay curve with no rise or plateau.
Related questions
In gamma decay, what is emitted?A positron has the same mass as an electron but a charge that is:In beta decay, which particles may be emitted?In alpha decay, which nucleus is emitted?How many types of radioactive decay occur in nature?Radioactivity is a decay undergone by a nucleus that is:Becquerel's emission penetrated black paper and:Becquerel made his discovery while studying: