The graph of stopping potential $V_0$ versus frequency $\nu$ is shown in the figure. From this graph, which statement is correct? 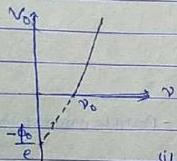
A$V_0$ decreases linearly with increasing $\nu$
B$V_0$ is independent of $\nu$
C$V_0$ increases linearly with $\nu$ and becomes zero at threshold frequency
D$V_0$ depends only on intensity and not on $\nu$
Answer & Solution
Correct answer: C. $V_0$ increases linearly with $\nu$ and becomes zero at threshold frequency
From Einstein's equation, $eV_0 = h\nu - \phi_0 = h(\nu-\nu_0)$. So $V_0$ varies linearly with frequency, and at the threshold frequency $\nu_0$, the stopping potential becomes zero. The figure shows this linear trend.

Related questions
In gamma decay, what is emitted?A positron has the same mass as an electron but a charge that is:In beta decay, which particles may be emitted?In alpha decay, which nucleus is emitted?How many types of radioactive decay occur in nature?Radioactivity is a decay undergone by a nucleus that is:Becquerel's emission penetrated black paper and:Becquerel made his discovery while studying: