Home › GUJCET › Chemistry › Ideal and Non-Ideal Solutions › The graph in the figure shows a solution whose t…
The graph in the figure shows a solution whose total vapour pressure is **higher** than that predicted by Raoult's law. Such a solution is a positive-deviation type. Which mixture is an example? 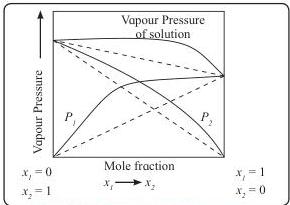
AEthanol + acetone
BChloroform + acetone
CBenzene + toluene
DPhenol + aniline
Answer & Solution
Correct answer: A. Ethanol + acetone
Positive deviation arises when solute–solvent interactions are **weaker** than the like-like interactions. In ethanol + acetone (or CS₂ + acetone), ethanol's H-bonding network is disrupted by the less interacting acetone — partial vapour pressures rise above Raoult prediction. Phenol + aniline and chloroform + acetone show **negative** deviation; benzene + toluene is nearly ideal.
Related questions
The nitric acid and water azeotrope holds nitric acid at about:Distilling an ethanol and water mixture stops at about:A large negative deviation produces an azeotrope that is:A large positive deviation produces an azeotrope that is:The components of an azeotrope cannot be separated by:Binary mixtures boiling at a constant temperature are called:Chloroform and acetone form a hydrogen bond, so the vapour pressure:A mixture of phenol and aniline shows: