A ball is thrown vertically upwards. Which of the following graph/graphs represent velocity-time graph of the ball during its flight (air resistance is neglected) 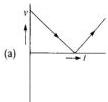 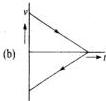 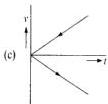 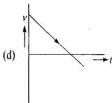
AA
BB
CC
DD
Answer & Solution
Correct answer: D. D
For a ball thrown vertically upward with air resistance neglected, the acceleration is constant and equal to $-g$ throughout the flight. Therefore the velocity changes linearly with time.
So the $v$-$t$ graph must be a straight line with constant negative slope.
Initially the velocity is positive, then it becomes $0$ at the highest point, and after that it becomes negative while the ball comes down.
Hence the correct graph is the one straight line sloping downward and crossing the time axis once.
Among the given figures, this matches option $D$.
Related questions
The branch describing the motion of a rotating rigid body about a fixed axis is rotationalSix washers on a light rod illustrate the moment of inertia of a system of:The more massive an object is, the more of this it has in linear motion:Unlike linear position measured in metres, angular position is measured in units that are:Acceleration caused by the change in direction of tangential velocity is called:Several torques acting about one axis are combined by finding their:The perpendicular distance from the axis to the line of the force is called the:The SI unit of torque is the newton multiplied by the: