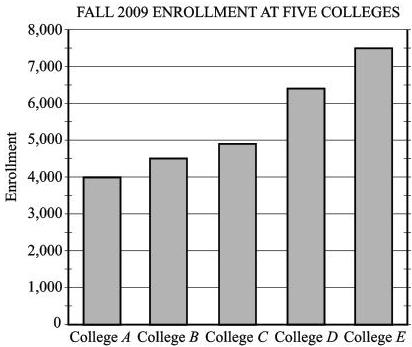
 The bar graph above (Data Analysis Figure 1) shows the fall 2009 enrollment at five colleges. Based on the graph, which college had the **greatest** enrollment?
ACollege A
BCollege B
CCollege D
DCollege E
Answer & Solution
Correct answer: D. College E
Identify the tallest bar in the chart. The bar for **College E** is visibly the tallest, indicating the largest enrollment.
The accompanying text confirms: "From the graph, we can conclude that the college with the greatest fall 2009 enrollment was College E and the college with the least enrollment was College A." The graph's vertical axis shows enrollment counts; reading bar heights left-to-right gives the order.
This question cannot be answered without consulting the chart — the bars carry the comparison information that the textual data otherwise omits.
Related questions
GMAT DS questions should be paced at:The sum of 5 consecutive integers is always divisible by:If x² = 36, what can we conclude about x?A GMAT PS question asks: 'What is x if 3x + 5 = 23?' Options: 4, 5, 6, 7. The fastest apprOn a percentage question with abstract values, the recommended smart-number to assume is:Is 1,287 divisible by 3?In a GMAT DS question, what is the FIRST step?In GMAT DS, answer choice (A) is selected when: